According to Statistics New Zealand, the region’s biggest export is milk powder, butter and cheese, topping out at a generous $11.2 billion, which is closely followed by business & personal travel at $10 billion followed by meat, wool and wood/logs. Trade is essential to New Zealand’s economic prosperity. Exports of goods and services make up around 30 percent of gross domestic product (GDP). New Zealand’s trade interests are well diversified, which are made up of Australia, China, North America, the European Union and the Association of South-East Asian Nations.

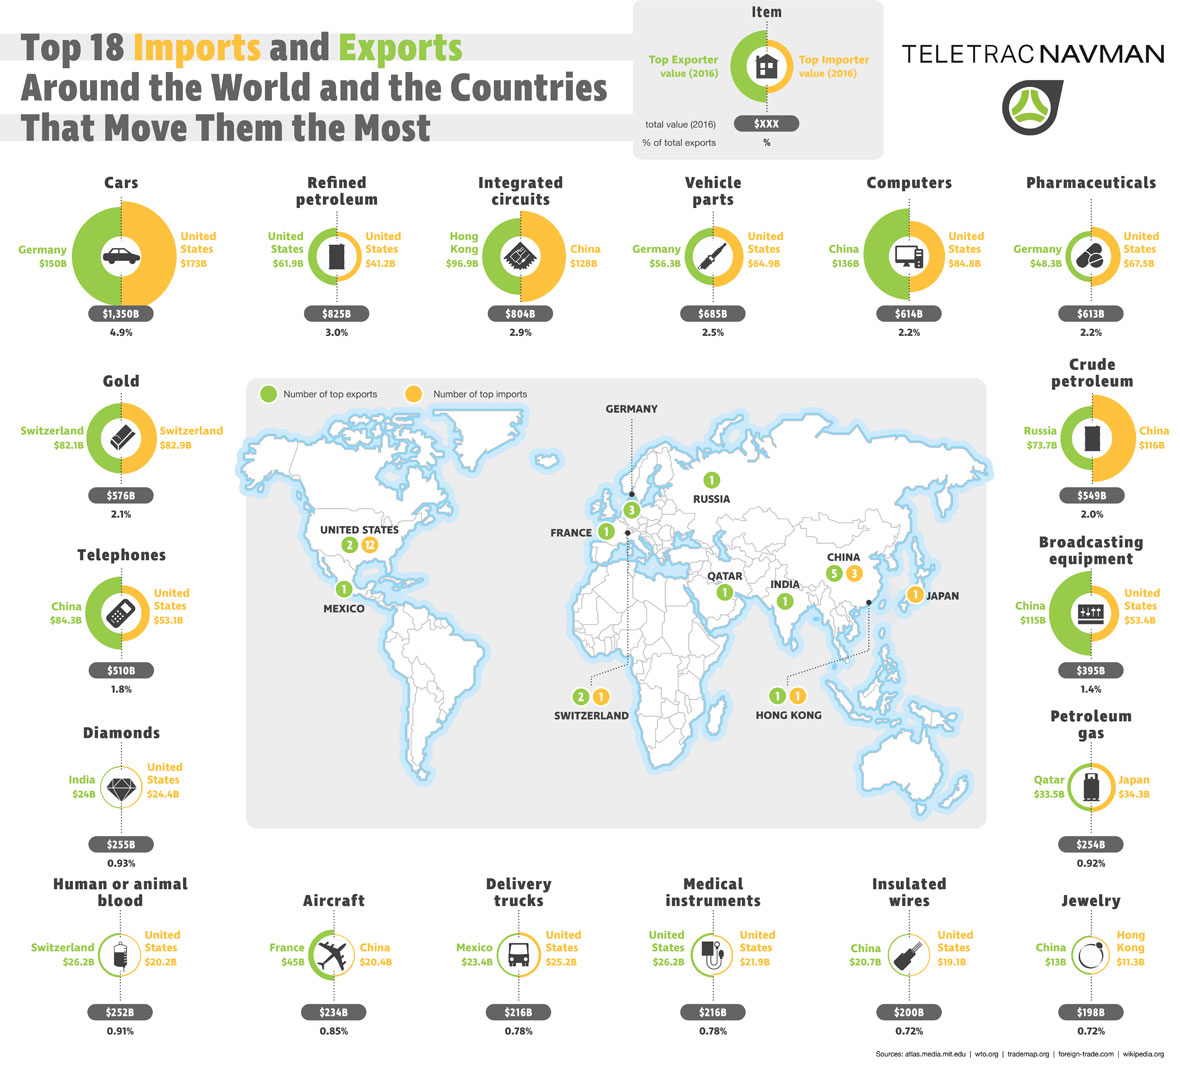
While the Observatory of Economic Complexity at the Massachusetts Institute of Technology records US based statistics, it also maintains a complete list of countries by imports and exports around the world. After analysing this data, we determined the top 18 imports and exports around the world by percent of total exports and the countries that move them the most.
What is the most exported product in the world?
Not surprisingly, cars are the most imported and exported product in the world by value. In 2016, the top exporter was Germany which exported $150 Billion in cars. The top importer was the United States which imported $173 Billion in cars.
Worlds Top Export Products 2016
Here are the top 10 exported products in the world in 2016 by total value shipped worldwide in 2016.
1. Cars ($1,350B)
2. Refined Petroleum ($825B)
3. Integrated Circuits ($804B)
4. Vehicle Parts ($685B)
5. Computers ($614B)
6. Pharmaceuticals ($613B)
7. Gold ($576B)
8. Crude Petroleum ($549B)
9. Telephones($510B)
10. Broadcasting Equipment ($395B)
Sources:
1 Investment statistics, statistics New Zealand, New Zealand Trade & Enterprise
https://www.nzte.govt.nz/investment-and-funding/investment-statistics

